
The Difference Between Data and a Data Dictionary
Most golf course operators cannot tell you their online tee time conversion rate, and next to none can tell you what actually happens between “landed on the page” and “gave up.” That gap isn’t really an analytics problem. It’s a documentation problem. The data is usually being collected. It just isn’t being explained.
What a Synced Funnel Actually Shows You
When a booking engine is properly synced with Google Analytics, an operator stops guessing about how golfers move through the process — they can see it, step by step. Here’s an example of what that funnel view can look like:
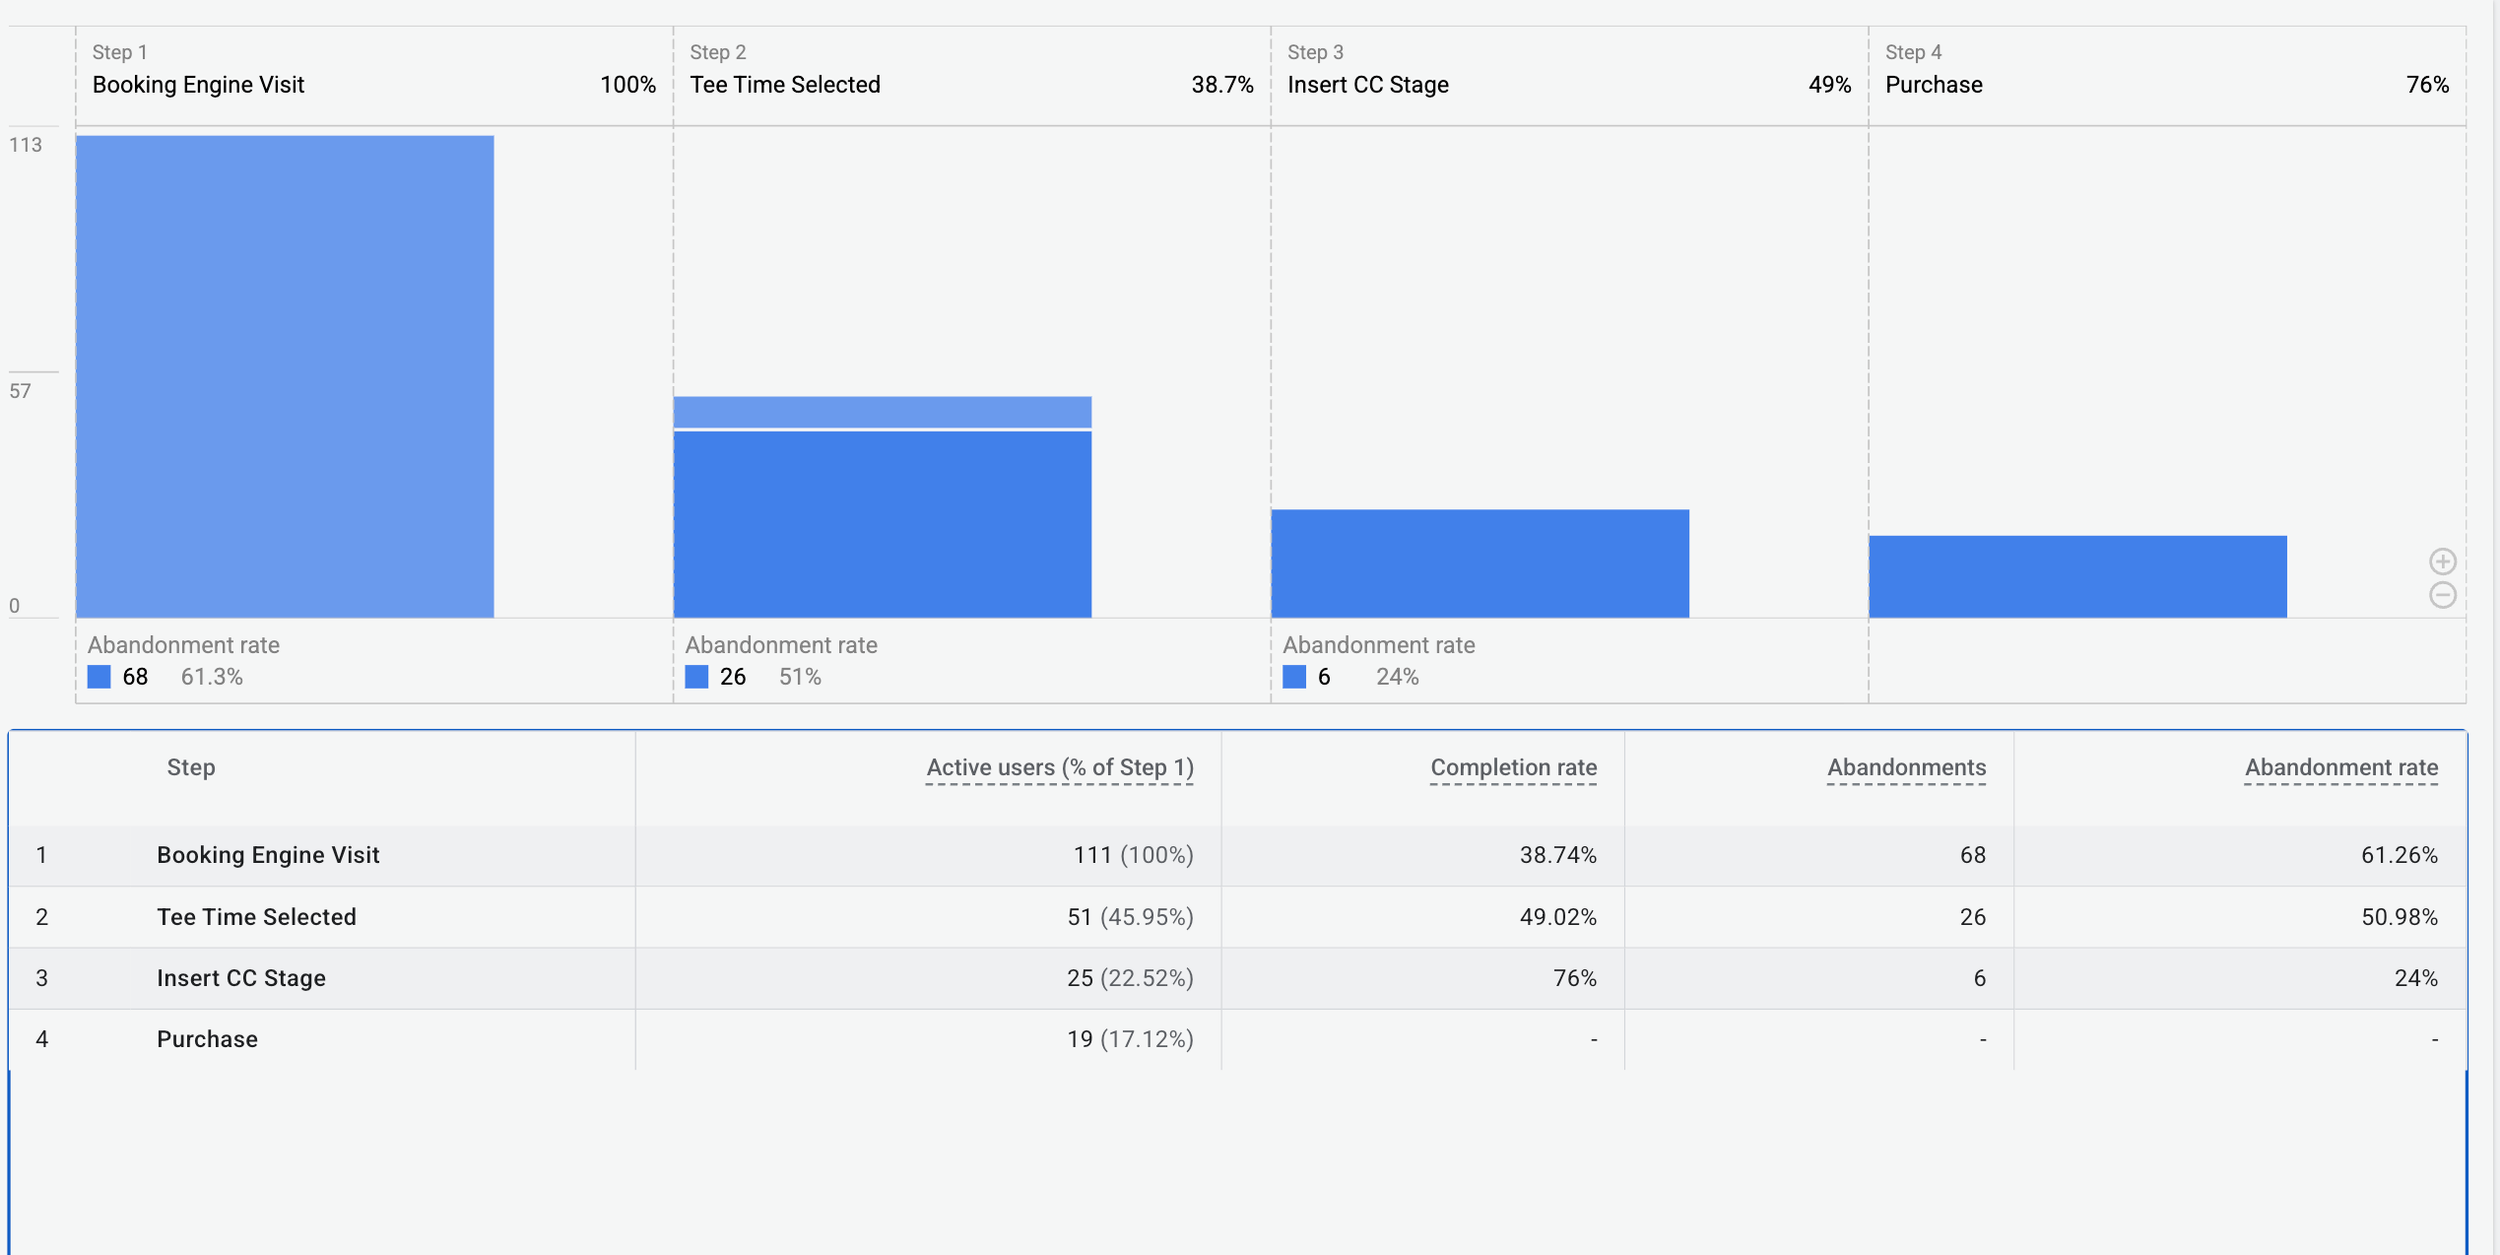
In this example, the biggest leak isn’t at checkout, where most operators assume it lives. It’s at the very top. Nearly 6 in 10 sessions (58.9%) never make it from landing on the page to actually selecting a tee time. Every step after that loses another meaningful chunk: 41.9% drop off before setting a player count, 32.6% before entering payment, and 20% abandon at payment itself.
That’s a genuinely useful chart. It tells an operator where in the process golfers are leaving. What it doesn’t tell them — at least not on its own — is why. And that’s where most booking engine analytics setups quietly fall short.
The Chart Isn’t the Deliverable
A funnel chart like the one above is only as useful as the definitions behind it. Two operators looking at the exact same 58.9% abandonment number could be looking at two completely different problems, depending on how the vendor defined “session start” and “select tee time” in the first place.
To actually get value out of a chart like this, two things need to be true on the vendor side.
1. A real data dictionary.
A data dictionary is a plain-language explanation of what each metric in a dashboard actually measures. Does “session start” count anyone who lands on the booking widget, including bots and accidental clicks? Does “abandonment” mean the golfer left the site entirely, or just that they paused on that step for more than a few minutes before continuing? Is “select tee time” logged the moment a golfer clicks a time slot, or only once they confirm it?
Without clear answers to questions like these, an operator is left interpreting someone else’s numbers instead of trusting them. A dashboard without a data dictionary isn’t really transparent — it’s just a chart with good production values.
2. Custom events for every meaningful click.
Step-level funnels are a good start, but they flatten a lot of nuance. The real diagnostic power comes from tracking custom events at the click level: date picker interactions, time slot selection, player count adjustments, coupon code entry, payment method selection, and anything else a golfer touches on the way to a completed booking.
The more granular the tracking, the more precisely an operator can find where the friction actually is — not just that something in the middle of the funnel isn’t working, but which specific interaction is causing golfers to hesitate or leave.
What to Ask Your Vendor
If you’re reviewing your own booking engine’s analytics, three questions are worth asking directly:
- Do you provide a data dictionary for every metric in our dashboard?
- Do you track custom events for individual clicks, or only step-level page views?
- Can we see abandonment broken out by device, referral source, and promotion?
If the answer to any of these is unclear, that’s a gap worth closing — not because the data is wrong, but because undocumented data is much harder to act on with confidence.
Why This Matters More Than It Looks
A golf course’s booking engine is often the single highest-traffic page on the entire website. Small improvements in that funnel — even a few percentage points at the point of biggest drop-off — tend to matter more to topline revenue than almost anything else an operator could optimize on the site.
But that only works if the operator can trust what the dashboard is telling them, and can see clearly enough to know what to fix first. A chart without documentation is a start. A data dictionary and click-level event tracking are what turn that chart into a plan.
We go deeper on measuring booking engine performance — including how AI is starting to help operators make sense of this data day to day — in the NGCOA webinar “Measure What Matters: Selling Tee Times in 2026,” hosted by Mike Hendrix, President of smbGOLF.
Register for the webinar →
Already missed it? Watch the video recap →